
Market Session Ultimate
Stop cluttering your charts with multiple indicators – Market Session Ultimate provides the context you need in one place.

Inside Bar with Signals
The Inside Bar Strategy indicator is a professional-grade tool designed to help traders identify and act on one of the most reliable price action patterns: the inside bar.
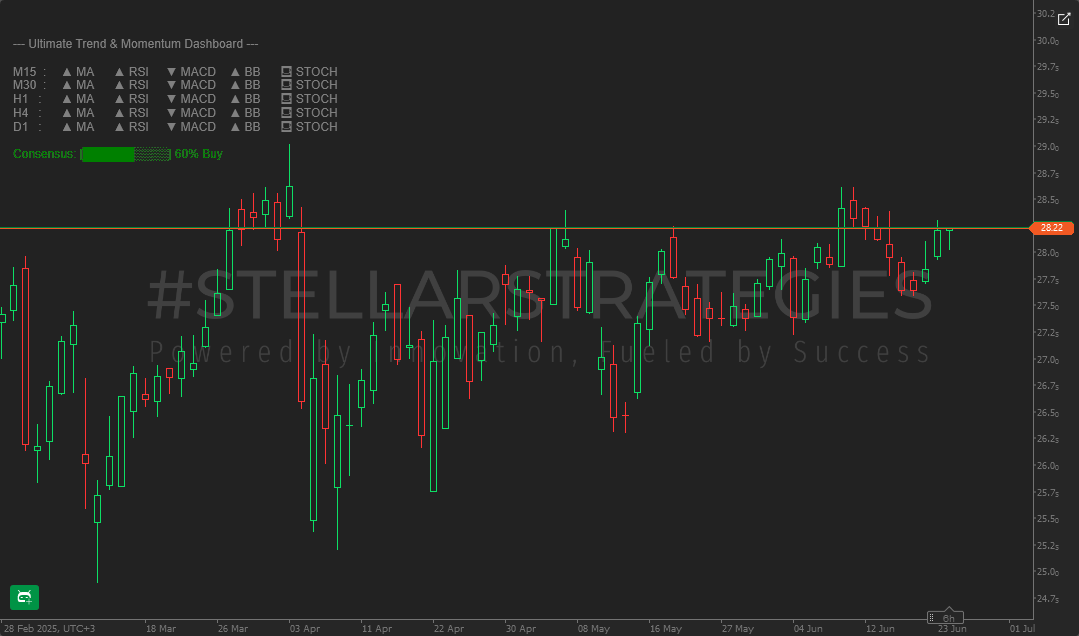
Ultimate Trend & Momentum Dashboard
Instead of cluttering your chart with dozens of separate indicators, it consolidates the signals from five popular technical indicators into a single, easy-to-read dashboard.

MARSI Signal Plotter
This indicator utilizes a combination of Moving Averages (MA) and the Relative Strength Index (RSI) to identify significant bullish and bearish trends in the market.

Market Structure Breakout
This indicator is designed to identify potential trading opportunities by detecting breakouts from recent price ranges on your cTrader chart.

Quantitative Qualitative Estimation (QQE)
The Quantitative Qualitative Estimation (QQE) indicator is a technical analysis tool designed to identify potential trend changes and trading signals.

Market Regime Filter
This indicator helps traders understand the prevailing market environment to filter trading signals or adjust their strategy accordingly.
![The "[Stellar Strategies] Linear Regression Candles" indicator for cTrader offers a unique approach to price analysis by visualizing candlestick data through the lens of linear regression slopes. Instead of displaying raw price movements, this indicator constructs candles that reflect the rate of change in open, high, low, and close prices, providing a distinct perspective on market momentum.](https://stellarstrategies.ee/wp-content/uploads/2025/06/cT_cs_4141285_SpotCrude_2025-06-25_16-33-02.png)
Linear Regression Candles
This indicator offers a unique approach to price analysis by visualizing candlestick data through the lens of linear regression slopes.

Visual Trend Momentum
Visual Trend Momentum, is designed to visually represent trend strength and momentum on a chart using a combination of moving averages (MAs), Average True Range (ATR), and volume analysis.
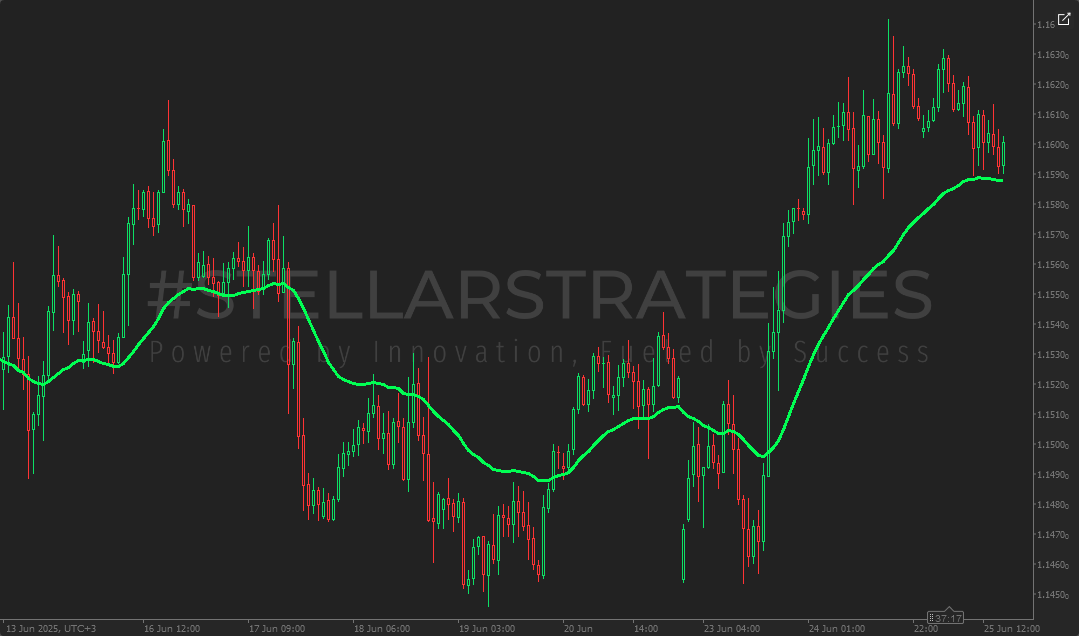
Moving Averages Combined
A smoothed representation of price action by averaging six moving averages: three Simple Moving Averages (SMA) and three Exponential Moving Averages (EMA).
![The [Stellar Strategies] BOS Trend is a premium multi-timeframe Break of Structure (BOS) indicator designed for cAlgo. It provides traders with critical insights into market trends by detecting uptrend and downtrend BOS across multiple timeframes.](https://stellarstrategies.ee/wp-content/uploads/2025/06/cT_cs_4141285_XAUUSD_2025-06-25_16-19-35.png)
Break of Structure Trend
The BOS Trend is a premium multi-timeframe Break of Structure (BOS) indicator designed for cAlgo. It provides traders with critical insights into market trends by detecting uptrend and downtrend BOS across multiple timeframes.